
Beyond the Headcount!

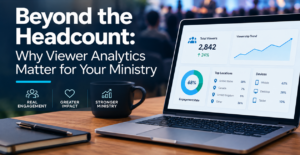
I love analytics but when managing a church live stream, it is easy to fixate entirely on a single number: the total view count. While seeing a spike in views is encouraging, a raw number only tells part of the story. We’re going to tell you more about analytics and why you should care.
For church admins and media teams, diving deeper into viewer analytics transforms your broadcast from a simple one-way video feed into a powerful pastoral tool.
What Analytics Reveal About Your Online Community
Streaming analytics go far beyond “counting heads”. They offer a clear window into how your digital congregation interacts with your ministry:
- Average Watch Time: If your service lasts 60 minutes, but your average watch time is 12 minutes, it gives your team critical feedback. Are viewers leaving during long announcements, or are you running into technical bottlenecks? Tracking retention helps you structure a service that keeps people engaged.
- Unique Viewers vs. Total Views: Total views can be inflated by page refreshes or spotty internet connections. Tracking unique viewers gives you an accurate snapshot of the actual individuals or households tuning in.
- Device and Platform Insights: Knowing whether your audience is watching on mobile phones, desktop computers, or living room devices (like Apple TV or Roku) changes how you communicate. If a large portion of your congregation watches on big screens at home, your pastors can intentionally connect with those “worshiping from their living rooms”.
- Improving Follow-Up and Assimilation: Knowing who is tuning in (first-timers versus returning online members) allows admins to trigger targeted, automated follow-up emails or connect online guests with digital pastors more effectively.
- Identifying Peak Engagement Content: By tracking when viewership peaks or drops during a service (e.g., during worship, announcements, or the sermon), pastors and admins gain qualitative feedback on pacing, service flow, and what content resonates most.
Data as a Ministry Tool
Ultimately, streaming analytics aren’t about corporate metrics—they are about shepherding. They help you identify your digital “front door”, understand when engagement dips, and ensure the Gospel message is reaching hearts as effectively online as it does in the room.
Take a look at your StreamingChurch.tv admin control panel’s analytics this week to see what your data is telling you about your online family!
How YouTube and Facebook Count Live-Stream Views

YouTube: As of August 24, 2026, YouTube counts a legitimate view when a live stream starts to play; there is no 30-second live-view threshold. Its live report separately shows total live views, average view duration, total watch time, average concurrent viewers, peak concurrent viewers, traffic sources, and retention. A raw view therefore indicates a playback start, not that someone watched a meaningful portion of a service.
Facebook: A standard Facebook video view is generally recorded after an aggregate three seconds of playback. Because video may begin automatically in the feed, a three-second count can include brief, incidental exposure as well as intentional viewing. Use longer-duration measures (for example, 1-minute views where available), minutes viewed, retention, and unique viewers alongside the headline view count.
Are most views intentional? Neither platform publishes a universal split showing that most church live-stream views come from direct, deliberate access rather than recommendation or feed exposure. Treat that as a question to answer from each stream’s traffic-source report—not an assumption. On YouTube, “Direct or unknown” includes direct URL entry, bookmarks, signed-out viewers, and unidentified apps; browse, suggested, search, channel-page, and external sources are reported separately. On Facebook, feed distribution and autoplay can add short views that may not represent a person who chose to attend the service.
Average watch time: There is no credible platform-wide average that applies to all YouTube or Facebook live streams, and church services vary greatly in length, audience habits, and discovery paths. Use the stream’s own average: YouTube reports estimated average minutes watched per view, while Facebook reports average watch time/minutes viewed in its video insights. Compare that number with service length, retention at key moments, and the share reaching 1 minute or more.
What this means for churches: Raw live-view totals can overstate sustained, intentional participation—especially on Facebook because of the short threshold and feed autoplay, and on either platform when a person reconnects or watches multiple sessions. But raw views can also understate households watching together. The most honest ministry dashboard pairs views with unique viewers (or estimated reach), average and total watch time, concurrent viewers, retention, and traffic source. These measures show whether a broadcast is being deliberately accessed and meaningfully watched, rather than treating every counted playback as an online attendee.
Want more info? We are always available to help, just reach out to StreamingChurch.tv today.
You can schedule a time with Phil Thompson here.
StreamingChurch.tv, Serving ministrties since 2001